How to generate reports
Tebi has a number of powerful reports that can help you manage your business by identifying what is working and what is not.
Report Types
To access these reports:
- Go to the Tebi Back Office > Reporting > Reporting
- Select the report type you want to generate
- Select the date range you want to be covered
- Press Generate to create the report you are looking for
- You can also download a .xlsx version of these reports by selecting Export after the report has been generated
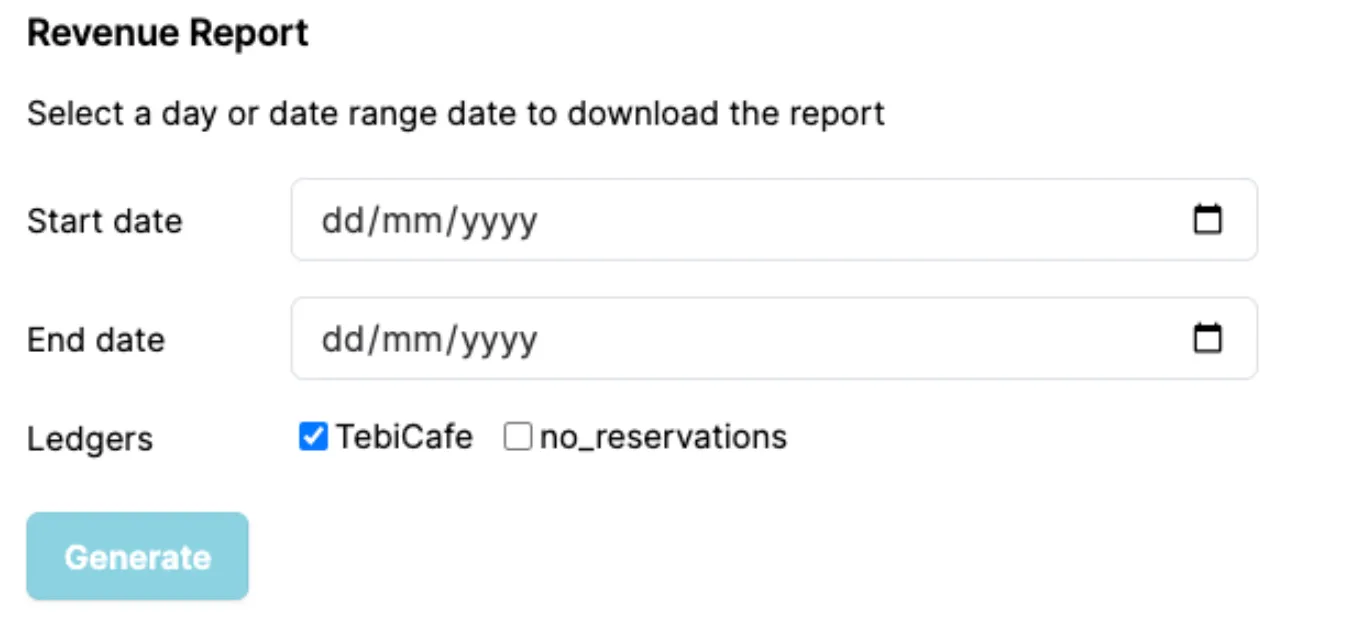
Revenue report
The revenue report covers the amount of money you have taken over the selected period and breaks this down by days to show tax liabilities and net and gross amounts of revenue.
Sales report
The sales report shows all sales that were closed in the selected time frame including customer names, areas, product amounts, sale open and close times, and sale ID. Use this to understand how long customers are spending at your venue, how much they spend and across which areas, or alongside the payment report to reconcile any differences.
Product report
The product report shows the number and value of products sold over the selected period, broken down by category.
Note: you can update your categories in the App or Back Office by opening up the Product. Keep in mind historical sales will also be updated to the new category, so make sure this works for your business.
Product orders report
The product orders report shows all products that were ordered over a selected period of time. As it contains detailed information about the product sales values and the order times it is useful for helping you prepare forecasts for the amount of products you may need for particular times and days of the week. The times shown are when products where submitted, which may not relate to the time a sale was closed.
Note: The report also shows products that were submitted and then removed from sales. These appear as products with negative quantity values.
Day report
The day report is a handy way to visualize and download data on your revenue for a selected period of time. The day report gives a real-time overview of how your business is doing. This report also includes the revenue and the cash flow, with insights into total card, cash, pre-paid and tips.
Day overview
The day overview report offers a complete overview of your business by showing the total revenue split by payment methods, potential differences, total tips and cash movements in and out of the cash drawer.
Revenue by product category report
This report bundles revenue across the selected period by products’ reporting categories.
Discount report
The Discount Report shows products sold across the selected period, split by the discounts that have been applied in the same time. This allows you to check discount usage and understand how this is affecting your margins.
Payments report
This shows a list of all payments from the selected period including a link to the sale receipts for the transaction. This is useful in understanding and reconciling payments across different payment methods.
Covers report
If you use covers and/or reservations this report shows the average spend per guest by dividing the revenue by the number of guests attached to sales.
Export report vs export data
When exporting from Reporting you have two options: Export reports which will provide an exact version of what you see when generating an export in the back office. If you would like to use the data for additional analysis, we recommend using the Export data feature which provides a stripped down version of the information with minimal headers, grouping and styling.
That’s a short introduction to Tebi’s reporting. You might also find the payment reporting in Adyen Essentials handy.
Multi-business reporting
If you have multiple business accounts with Tebi, use multi-business reporting to combine reporting data from all your businesses.
When multi-business reporting is enabled, select the businesses you want to report on and they will be included in a aggregated report.
Please contact support@tebi.com to enable multi-account reporting.