Forecasting
You can now find a revenue forecast in the Tebi back office → Analytics section.
With this feature you will be able to get a better idea of how your revenue will look over the next 7 days, 14 days and 21 days. We hope that this information can support your planning, and reduce the uncertainty of what’s ahead for your business.
How does this come together?
We create this revenue estimate by looking at previous sales patterns, events such as bank holidays and the weather forecast. Since the weather is a big part of the calculation, and it is notoriously unpredictable, the forecast is likely to be more accurate fewer days in advanced. We updated every morning at 9am to make sure the latest data is incorporated.
How to interpret the chart?
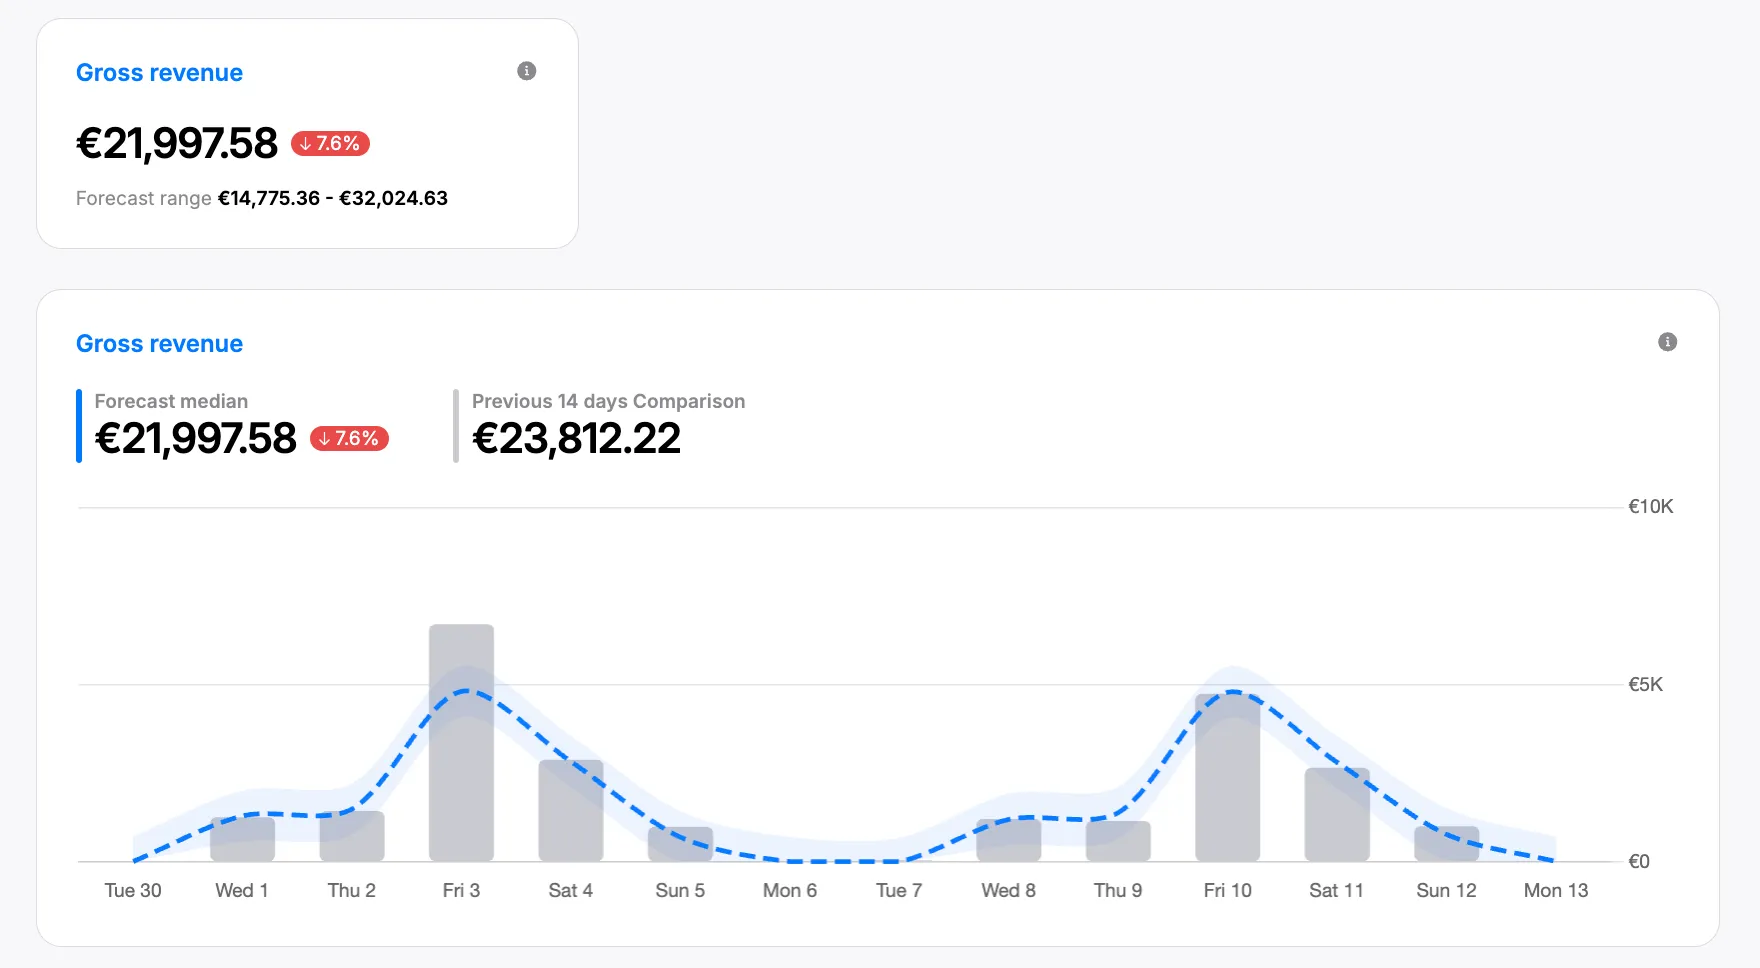
- The grey bars in the chart show the revenue of the previous numbers of days selected to compare the forecast against.
- The trend icon shows if the forecast is expected higher (green) or lower (red) than the previous weeks revenue.
- The forecast total at the top of the chart is the total revenue forecasted for that period.
- The comparison total at the top of the chart is total revenue from the previous period.
- Hovering over the forecast shows the range of the forecast (high, median, low) and the revenue compare to the previous period.